
If you've ever found yourself staring blankly at a math equation, wondering how on earth you're supposed to visualize it—you're not alone. The Desmos Graphing Calculator, a widely-used online graphing tool, helps students and educators transform algebraic expressions, geometric shapes, and calculus functions into clear, interactive graphs. In this guide, we’ll walk you through how to use the Desmos Graphing Calculator step by step, explore its most useful features, and explain why it's become a favorite for visual math learning. Later on, we’ll also introduce a newer graphing calculator alternative that builds on the same ideas—with even more flexibility, advanced editing tools, and presentation-ready visuals.
What Is Desmos and Why Students Use It for Math Help
Desmos is a free online graphing calculator that allows students to enter equations and see them instantly plotted on a coordinate plane. It’s like having a superpower that turns math symbols into visual art—no cape required.
Here’s why math learners love it:
It makes abstract concepts tangible and visual.
You can explore real-time graphs without needing a physical calculator.
It’s widely used in classrooms, SAT prep, and online learning platforms.
Whether you're studying algebra, geometry, or calculus, Desmos helps make sense of it all.
How to Use Desmos Graphing Calculator: A Step-by-Step Guide
Even if you've never touched a graphing calculator before, Desmos makes it incredibly easy to get started. Here’s a quick walkthrough:
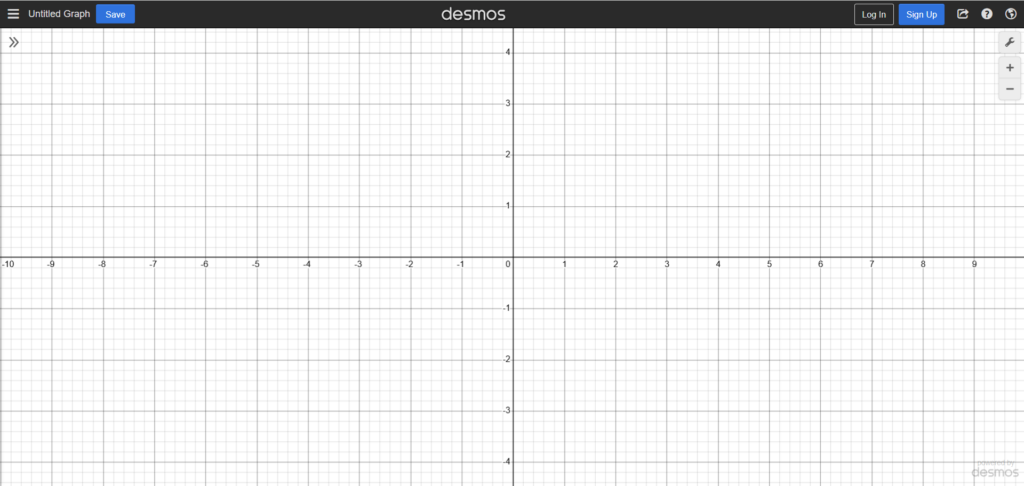
Step 1: Open the Desmos Graphing Calculator Online or in the App
Head over to desmos.com or download the Desmos app on your mobile device. No sign-up is needed for the basic calculator features, which is always a win.
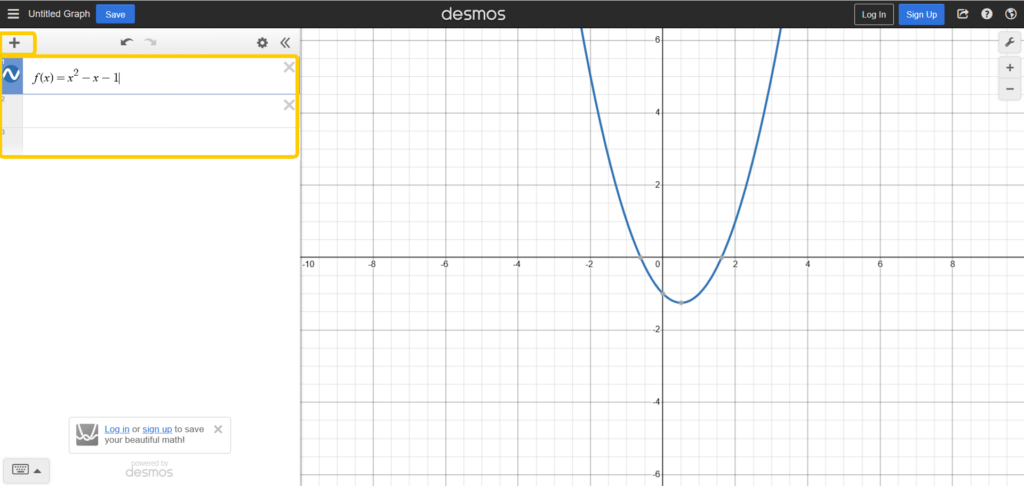
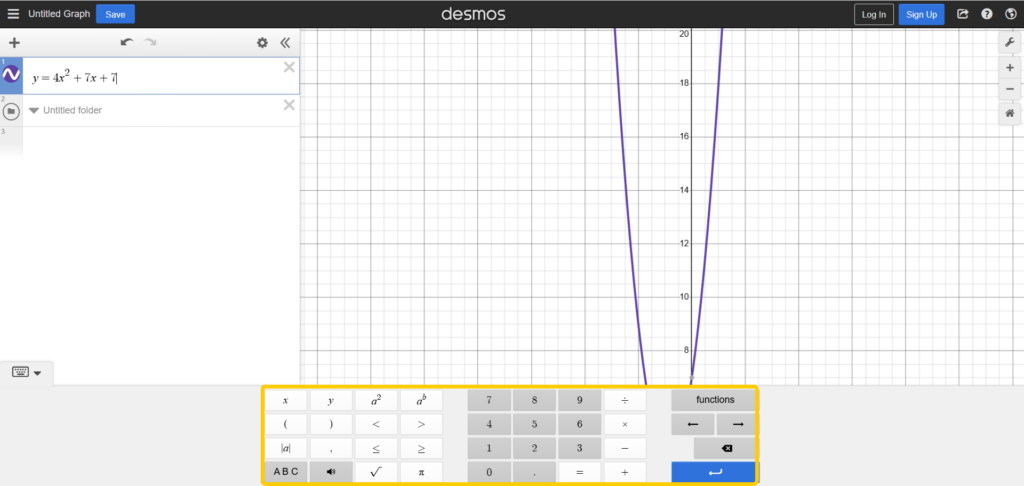
Step 2: Input Math Equations or Functions
Start typing equations like: y = 2x + 3
Desmos will plot it immediately. You can add multiple functions—linear, quadratic, exponential, trigonometric—you name it.
It supports:
Systems of equations
Polar coordinates
Piecewise functions
Inequalities (e.g., y < x² + 1)
Step 3: Explore Graphs and Visualize Concepts
Each equation is automatically color-coded, and graphs are dynamically updated as you tweak values. This is a lifesaver when trying to understand the impact of coefficients or transformations.
Try changing a number in your function and watch the graph morph in real time—math becomes less of a chore and more of a game.
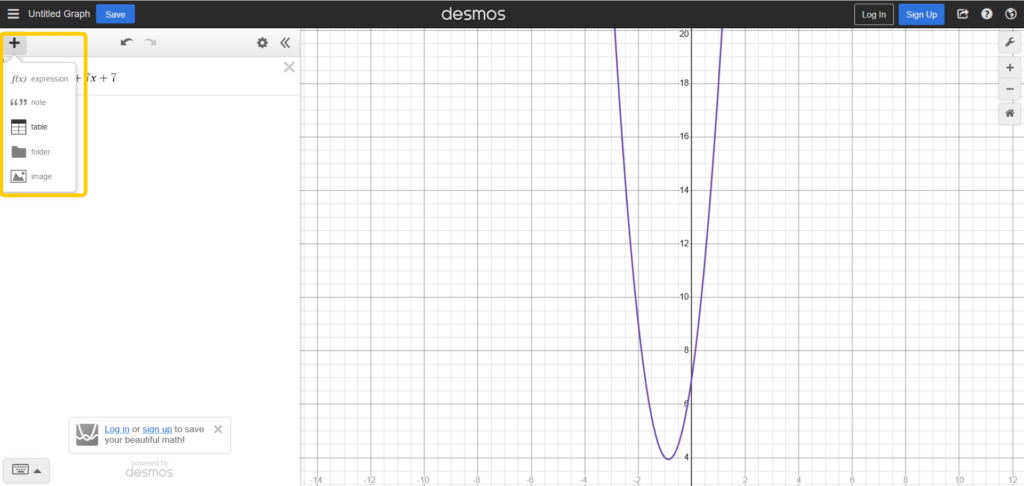
Step 4: Use Sliders, Tables, and Annotations for Deeper Insight
Add sliders to turn constants into variables. For example:
y = ax² + bx + c
With sliders for a, b, and c, students can experiment with how each coefficient changes the shape of a parabola.
Add tables to compare input/output values or use Desmos's annotation tools to label key points like intercepts and turning points.
Top Features of Desmos for Math Students
Why is Desmos the go-to for millions of math students? Let’s break it down.
Intuitive and Interactive Graphing Interface
Desmos offers an incredibly responsive interface where graphing doesn’t feel intimidating. You get immediate feedback, which makes experimentation feel natural.
Real-Time Visualization of Equations
Instant plotting makes it perfect for visual learners. The more you interact with functions, the deeper your understanding becomes.
Supports Complex Functions and Inequalities
From trig identities to logarithmic functions, Desmos handles it all. Need to graph a system of inequalities? Easy.
Great for Geometry, Calculus, and Statistics
Whether you’re sketching conic sections or exploring derivatives, Desmos is flexible enough to help students across different math domains.
Shareable Graphs and Classroom Integration
Teachers can create interactive lessons using Desmos Activity Builder. Students can save graphs, share links, and even submit work digitally.
Tips for Using Desmos Effectively in Math Learning
Want to level up your Desmos game? These pro tips will help you get the most out of the tool:
Start with Simple Functions to Build Intuition
If you're new to graphing, don't start with crazy complex functions. Begin with y = x, y = x², or y = sin(x)—then gradually add variations.
Use Colors and Labels to Organize Graphs
Color-code each function and add labels. It makes your graphs easier to understand and present—especially if you're working on a class project or explaining your solution.
Combine with Class Notes or Homework Problems
Use Desmos alongside your textbook or class notes. When a problem asks for a graph, try plotting it out in Desmos for a clearer understanding.
Explore Desmos Activity Builder for Interactive Lessons
This is a game-changer for classrooms. Activity Builder allows teachers to create dynamic math activities with built-in response checking, discussions, and visual feedback.
Where Desmos Falls Short: What It Doesn’t Offer
While Desmos is a brilliant tool, it's not perfect. Here are a few areas where students might feel limited:
- Graphs are not editable after export – You can view or share them, but you can’t tweak them on the go.
- No image/PDF export built-in – Screenshots are your best bet.
- Sign-up required for saving graphs long-term – No account, no history.
- Limited annotation flexibility – You can’t fully customize labels, shapes, or highlights.
- Interface feels dated on some devices – Especially compared to newer tools.
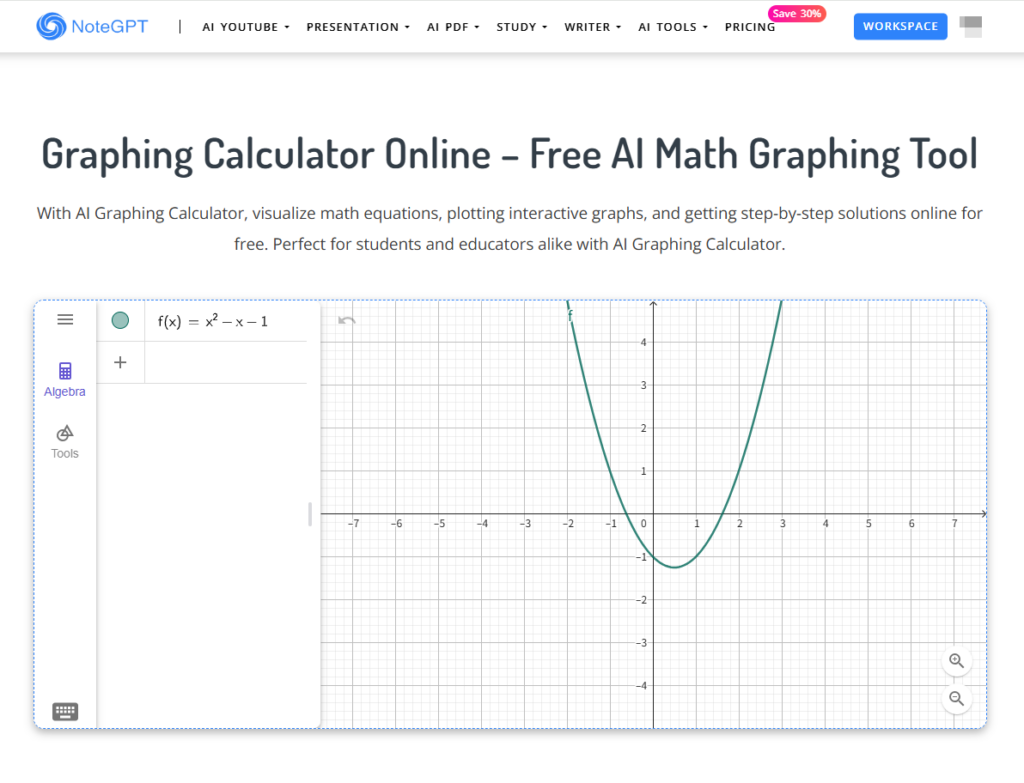
A Smarter Alternative: NoteGPT’s AI Graphing Calculator
As great as Desmos is, it’s not the only graphing calculator in town anymore. NoteGPT’s Graphing Calculator is here to give math learners an upgrade—combining visual clarity, powerful editing tools, and a sleek, user-friendly interface.
If you’ve ever wished your calculator was more hands-on, more customizable, and easier to share, this is your moment.
Why Choose NoteGPT Graphing Calculator Over Desmos?
Desmos lets you graph equations beautifully—but NoteGPT takes it a step further by letting you interact with those graphs in ways that feel almost artistic.
Here’s why NoteGPT is becoming the new favorite among students and educators:
Interactive editing tools built right in – move points, drag lines, explore intersections, or tweak sliders, all directly on the graph.
No sign-up or login walls – get straight to graphing without wasting time.
Clean, modern visuals – every graph looks polished and presentation-ready.
Downloadable graphs – export as high-quality PDF or PNG files for easy inclusion in assignments or reports.
With Desmos, you observe. With NoteGPT, you create.
Key Features of NoteGPT Graphing Calculator
The heart of NoteGPT’s graphing tool is this: you’re not just generating graphs—you’re interacting with them.
Unlike traditional calculators that freeze your chart once it's rendered, NoteGPT gives you a fully editable canvas with a toolbox designed to help you explore, tweak, and truly understand the math behind the lines.
Here’s what makes it unique:
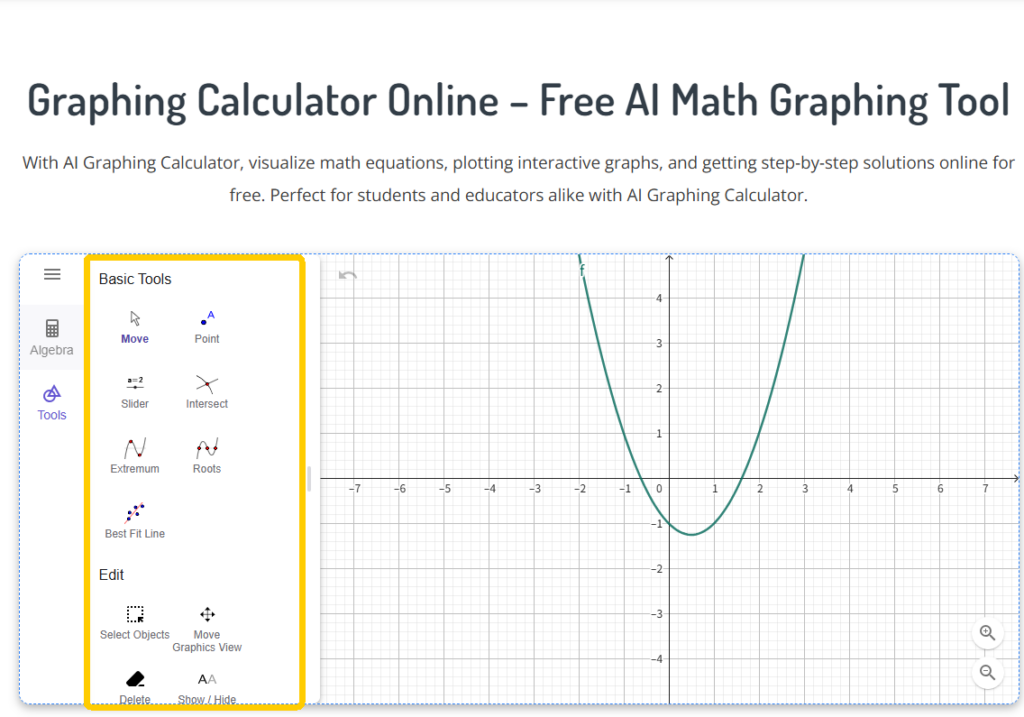
Powerful Visual Editing Tools – Whether you're adjusting a curve, exploring intersections, or adding sliders to test variables, NoteGPT gives you a full set of graph interaction features. Think of it as your math sandbox.
Dynamic Graph Manipulation – Zoom in, drag elements, highlight key points, or trace paths—math comes alive when the graph responds to you.
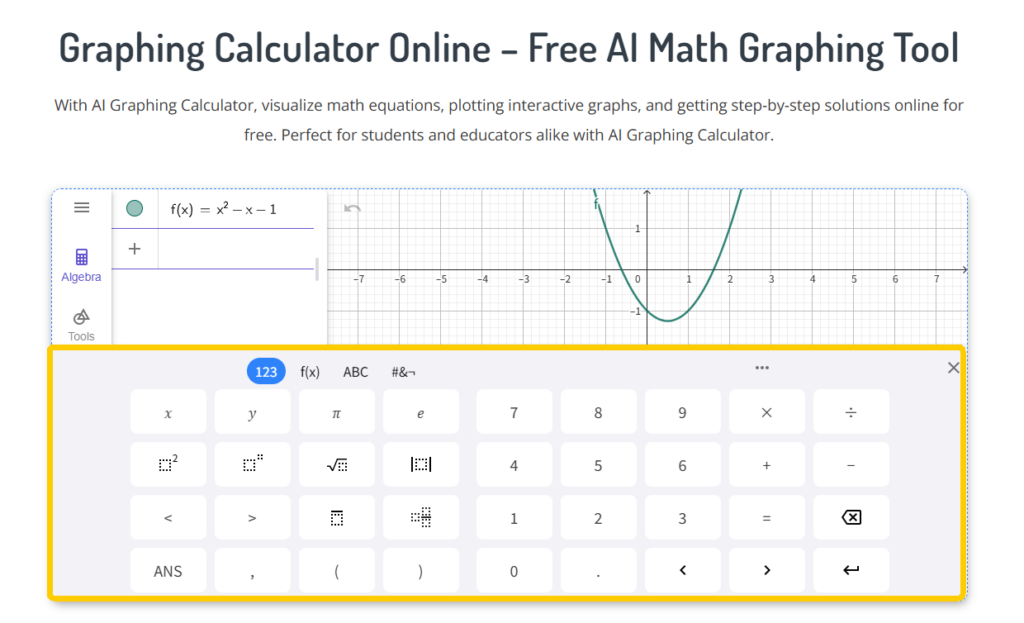
Minimalist, Distraction-Free UI – The interface is built to feel light and intuitive, so you can focus purely on the math, not the menus.
Multi-layer Visual Structure – Overlay multiple functions with ease and edit each layer independently, great for comparisons or advanced plotting.
Education-Ready by Design – Whether you're a student reviewing class material or a teacher prepping a lesson, every feature is made with clarity and communication in mind.
It’s more than a calculator—it’s an interactive graphing workspace.
Advanced Benefits of NoteGPT Graphing Calculator
NoteGPT isn’t just functional—it’s delightfully useful.
Here’s what makes it stand out from most free online graphing calculators:
Precise control over every graph element – unlike static tools, you can fine-tune points, zoom ranges, and function domains with full freedom.
Beautiful design by default – graphs are auto-aligned, color-coded, and easy on the eyes, even when complex.
Seamless export options – download your finished graph as PDF for printing or as PNG for slides, assignments, or websites.
Ideal for teachers and students alike – whether you're building study guides or math explainer videos, NoteGPT helps you make your visuals count.
And because everything is built for instant online access—no installations, no clutter—you can graph from your laptop, tablet, or phone, anytime.
Conclusion
The Desmos Graphing Calculator has earned its place as a trusted companion for math learners, and it remains a fantastic, accessible tool. From plotting simple lines to complex inequalities, it's changed how we visualize math in real time.
But as we head into 2025, a new generation of math tools is rising—and NoteGPT Graphing Calculator is leading the charge.
With editable graphs, no sign-up, beautiful exports, and a UI that makes math feel modern again, NoteGPT isn’t just catching up to Desmos. It’s going beyond.
Whether you’re a student trying to nail that next calculus test, a teacher designing visual lessons, or just someone who wants math to make more sense, give NoteGPT’s Graphing Calculator a try.